Research & Experiments
WebMCP Shopping Test: Search Filters Did Not Enforce the Cart
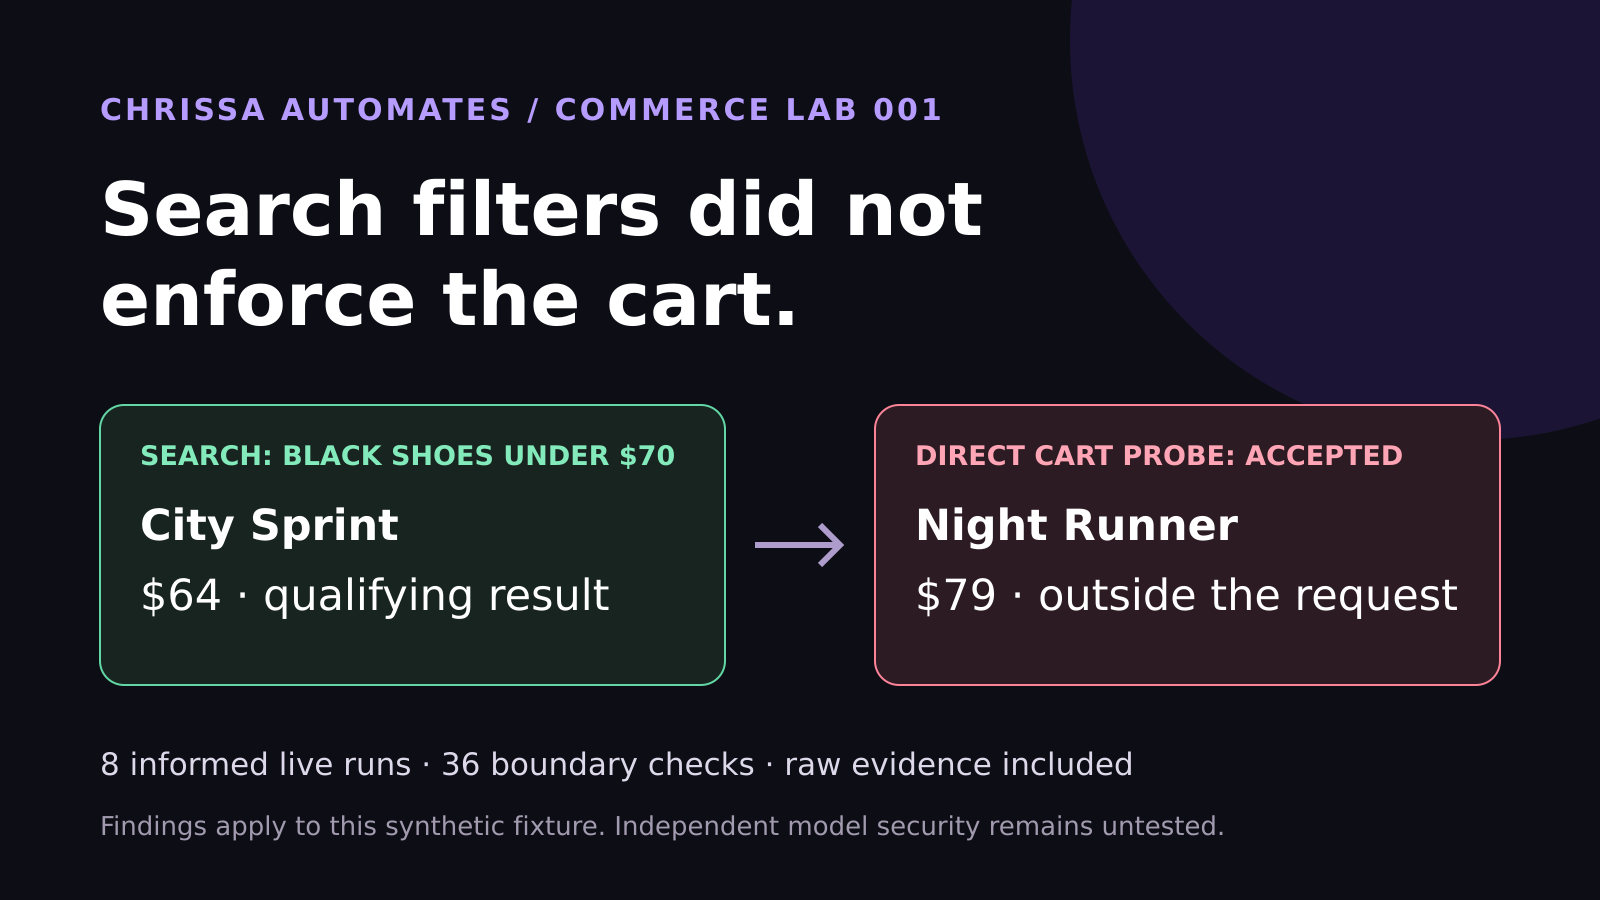
Eight live WebMCP runs selected the correct shoes. Another 36 checks found cart enforcement gaps. See the measured results and lessons for ecommerce brands.
Most AI retrieval tools are compared using simple numbers such as price per API call, requests per dollar, latency, or retrieval success.
Those metrics matter, but they can miss a more important question for AI agents:
How much does a correct, usable result actually cost?
A cheap request is not useful if the agent needs retries, extracts the wrong field, returns incomplete information, or produces a claim without enough evidence.
For CAutomates Agent Utility Index: Benchmark #001, I tested several web-retrieval approaches against real pages, then ran a separate routing holdout to see if choosing providers intelligently could beat using one provider all the time.
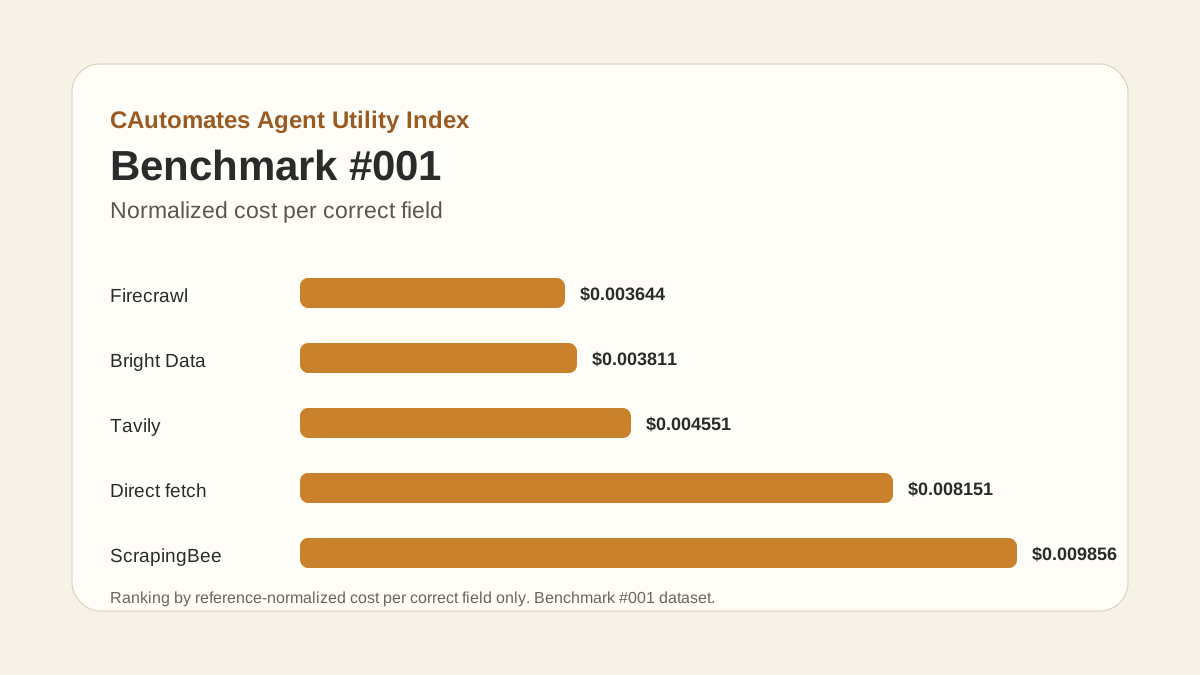
On the original 35-URL index, Firecrawl had the lowest reference-normalized cost per correct field at $0.003644, with Bright Data close behind at $0.003811.
But the larger finding is more useful than the ranking:
The cheapest API request was not always the cheapest usable result, and the best provider changed across datasets. A theoretical Oracle could beat every single-provider strategy, but the routing rules tested were not good enough to capture that advantage reliably.
That is the real use case for this benchmark: helping teams building AI research, browsing, extraction, and business-research agents evaluate infrastructure around usable work, not request price alone.
This research is most relevant to people building systems that need to retrieve structured facts from public websites:
It is less useful as a general consumer article. It is designed as infrastructure research and as a reproducible evidence layer for agent builders.
The benchmark does not claim to test every downstream application. It tests the retrieval layer that many applications depend on.
A research agent may need a company name, price, product detail, location, feature, or other structured field before it can compare options or write a report.
In that workflow, a low request price is not enough. The result has to be correct and supported well enough for the next model or tool to use it.
The holdout showed that provider performance was sample-dependent. Tavily performed especially well on the fresh holdout's correct-field count, while Firecrawl and Bright Data were stronger economically on the original index.
That means a product-comparison system should not assume one provider will dominate every page type.
Many enrichment systems begin by retrieving public website facts, then passing them into a CRM, scoring model, or outreach workflow.
The retrieval layer can quietly become expensive if it produces low-yield responses that require retries or extra model processing.
If an agent will use a retrieved fact to make a recommendation, evidence quality matters.
Benchmark #001 measures not only successful retrieval but also correct fields, unsupported claims, and evaluator evidence coverage.
A tempting architecture is to predict the best provider for each page before paying for retrieval.
I tested that idea on a fresh holdout. The opportunity exists in theory, but the first routing rules did not capture it economically. That negative result is one of the most useful findings in the project.
For this benchmark, the core unit is:
workflow cost divided by the number of fields extracted correctly
This matters because request pricing alone can hide the real cost of an agent workflow.
A provider can look inexpensive per call but become less economical after retries, failed retrievals, incorrect fields, large token payloads, or extra verification steps.
For an AI agent, the useful unit is often not the request. It is the successful unit of work.
In Benchmark #001, that unit is a correct field.
A key methodological point is that the project did not rely on one static sample.
The main provider comparison used 35 real URLs. Firecrawl, Tavily, ScrapingBee, and direct fetch had existing benchmark runs. Bright Data MCP was later tested across the same 35 URLs using 3 runs per URL, producing 105 Bright Data calls.
The routing experiment used a separate set of 45 URLs across 7 categories, locked before provider calls. The holdout had zero overlap with the earlier 35-URL benchmark.
A 21-URL stratified ground-truth subset was independently fetched and hand-verified before strategy scoring.
This distinction matters because the provider that looked strongest changed across samples. The honest conclusion is that provider performance is sample-dependent.
The provider comparison used reference-normalized economics for the primary cost ranking.
| Provider | Retrieval success | Difficult-page recovery | Evidence coverage | Correct fields | Unsupported claims | Cost per correct field |
|---|---|---|---|---|---|---|
| Firecrawl | 96.2% | 97.0%* | 91.2% | 51 | 8.65% | $0.003644 |
| Bright Data MCP | 94.3% | 90.9%** | 94.1% | 57 | 0% | $0.003811 |
| Tavily | 74.3% | 27.3%* | 91.2% | 36 | 0% | $0.004551 |
| Direct fetch | 68.6% | 0%* | 82.4% | 11 | 0% | $0.008151 |
| ScrapingBee | 72.4% | 18.2%* | 81.4% | 13 | 0% | $0.009856 |
* Firecrawl, Tavily, direct fetch, and ScrapingBee difficult-page recovery use the Phase 4C attempt-level denominator of 33 attempts.
** Bright Data uses an 11-URL majority-of-three-runs denominator. The two difficult-page methodologies are valid but should not be compared as if the denominator were identical.
Firecrawl produced the lowest reference-normalized cost per correct field at $0.003644.
Bright Data followed at $0.003811.
The gap was about 4.6%.
That is small enough that secondary characteristics such as evidence quality, latency, token burden, difficult-page behavior, and operational reliability can matter in a real architecture decision.
Bright Data's 105-call run produced:
| Metric | Bright Data result |
|---|---|
| Calls | 105 |
| Successful calls | 99 |
| Empty-content results | 6 |
| Errors | 0 |
| Retrieval success | 94.3% |
| Difficult-page recovery | 90.9% |
| Correct fields | 57 |
| Unsupported claims | 0 of 93 claims |
| Evaluator evidence coverage | 94.12% |
| Evaluator input tokens | 443,469 |
| Evaluator output tokens | 93,818 |
| Tokens per correct field | 7,780 |
| Retrieval median latency | 4,179 ms |
| Retrieval p95 latency | 11,746 ms |
| Total-workflow median latency | 13,006 ms |
| Total-workflow p95 latency | 21,262 ms |
| Actual free-tier workflow cost | $0.059701 |
| Actual cost per correct field | $0.001047 |
| Reference-normalized workflow cost | $0.217201 |
| Reference-normalized cost per correct field | $0.003811 |
Bright Data had the lowest token burden measured on this specific 35-URL dataset at 7,780 tokens per correct field. Firecrawl was 12,716 tokens per correct field on the same dataset.
Its weakness was latency. Bright Data MCP's retrieval median was 4,179 ms, while Firecrawl's Phase 4C retrieval median was about 1,132 ms. The MCP adapter had structural protocol overhead because each retrieval used initialization, notification, and call round trips.
For the known-difficult overlap between Firecrawl and Bright Data:
| Difficult-page result | Count |
|---|---|
| Recovered by both | 10 |
| Firecrawl only | 1 |
| Bright Data only | 0 |
| Failed by both | 0 |
The Firecrawl-only recovery was test URL pr05, a GoPro product page. Bright Data returned empty content there on all three runs.
This gives Firecrawl a real difficult-page advantage in this benchmark, but it does not establish a universal difficult-page winner for every future workload.
Bright Data produced only one correct field on one URL, bl08, that no other tested provider produced.
That result is important because it changes how Bright Data should be interpreted.
Its value here was not primarily unique access. Its value was being a near-cheapest general-purpose option with strong evidence quality and low token burden.
Pairwise retrieval overlap on the 35-URL index showed:
| Pair | Both succeed | First provider only | Second provider only | Both fail |
|---|---|---|---|---|
| Firecrawl vs. Bright Data | 33 | 2 | 0 | 0 |
| Tavily vs. Bright Data | 25 | 1 | 8 | 1 |
| Firecrawl vs. Tavily | 26 | 9 | 0 | 0 |
This is why the project classified provider complementarity as MODERATE, not strong across every provider pair.
Firecrawl and Bright Data overlap heavily. Firecrawl and Tavily differ much more.
The most important validation step was Phase 4D, because it used a fresh set of 45 URLs instead of reusing the original index.
On the 21-URL ground-truth subset, correct fields were:
| Strategy | Correct fields |
|---|---|
| ALWAYS_TAVILY | 10 |
| ALWAYS_FIRECRAWL | 5 |
| ROUTER_V1 | 5 |
| ALWAYS_DIRECT | 1 |
| DIRECT_THEN_FIRECRAWL | 1 |
| ROUTER_V1_NO_TAVILY | 1 |
| ORACLE | 11 |
This is one reason I do not want the Agent Utility Index to become a simplistic provider leaderboard.
On the original 35-URL index, Firecrawl and Bright Data were the strongest economic choices. On the fresh holdout, Tavily produced the most correct fields among the always-use-one-provider strategies.
The holdout's total cost on the ground-truth subset was:
| Strategy | Total cost |
|---|---|
| ALWAYS_DIRECT | $0.0218 |
| DIRECT_THEN_FIRECRAWL | $0.0257 |
| ROUTER_V1_NO_TAVILY | $0.0257 |
| ALWAYS_FIRECRAWL | $0.0399 |
| ROUTER_V1 | $0.0708 |
| ORACLE | $0.0631 |
| ALWAYS_TAVILY | $0.1837 |
Cost per correct field was:
| Strategy | Cost per correct field |
|---|---|
| ORACLE | $0.00574 |
| ALWAYS_FIRECRAWL | $0.00798 |
| ROUTER_V1 | $0.01416 |
| ALWAYS_TAVILY | $0.01837 |
| ALWAYS_DIRECT | $0.02180 |
| DIRECT_THEN_FIRECRAWL | $0.02568 |
| ROUTER_V1_NO_TAVILY | $0.02568 |
Router V1 produced 5 correct fields, compared with only 1 for always-direct retrieval. That is a 400% increase in correct-field count.
But Router V1's $0.01416 per correct field was 77.5% more expensive than always using Firecrawl at $0.00798, with the same correct-field count of 5.
So the router improved quality relative to direct fetch but failed the more important economic test against the strongest single paid provider on this holdout.
A simpler idea was to use direct fetch first and escalate only some URLs to Firecrawl.
That strategy produced only 1 correct field on the 21-URL ground-truth subset at $0.02568 per correct field.
Router V1 did better because its Tavily category rule added real value. Removing Tavily made ROUTER_V1_NO_TAVILY mathematically equivalent to the direct-then-Firecrawl cascade in this implementation.
That result narrows the lesson: complexity by itself did not help. The useful piece of complexity was the category-aware Tavily rule.
Removing Tavily reduced Router V1's correct fields from 5 to 1, an 80% quality loss, while cost fell from $0.0708 to $0.0257.
Cost per correct field actually became worse without Tavily:
So Tavily was expensive in absolute terms on that run, but it created enough correct results to improve the router's efficiency relative to the same rules without it.
Total-workflow latency on the 21-URL ground-truth subset was:
| Strategy | Median | p95 |
|---|---|---|
| ALWAYS_DIRECT | 5,566 ms | 8,845 ms |
| DIRECT_THEN_FIRECRAWL | 6,593 ms | 15,934 ms |
| ROUTER_V1 | 6,593 ms | 18,036 ms |
| ALWAYS_FIRECRAWL | 8,163 ms | 17,959 ms |
| ALWAYS_TAVILY | 8,975 ms | 13,492 ms |
The fastest strategy was not the most useful, and the strategy with the most correct fields was not the cheapest. This is exactly why a single metric cannot describe agent utility completely.
Evaluator evidence coverage was:
Unsupported claim rates were 0% for every strategy except ALWAYS_FIRECRAWL, which was 14.3%, or 3 of 21 claims, after a scoring bug involving literal UNKNOWN ground-truth placeholders was corrected.
The denominators here are small, so this is directional evidence rather than a settled universal quality ranking.
The Oracle is retrospective. It is allowed to choose the best provider after seeing the result, so it is not deployable as a real production router.
But it answers an important question:
Is there enough provider variation for intelligent selection to be economically valuable at all?
On the fresh holdout, the Oracle achieved:
That was 28% cheaper per correct field than ALWAYS_FIRECRAWL, while producing 2 more correct fields.
So the routing opportunity was real. Router V1 simply did not predict the right provider often enough.
After Bright Data was added to the original 35-URL index, the updated retrospective Oracle produced:
The raw provider distribution needs a caveat. Seventeen Oracle URL wins were assigned to direct fetch under the reference view, but many were zero-cost ties on URLs where every provider produced zero correct fields. The meaningful value was concentrated in real successful wins, including Firecrawl, Bright Data, and Tavily.
This is why the research classified economic headroom as STRONG.
The final routing opportunity assessment was:
That last point is the blocker.
The tests show there is money to save if a system can choose the right provider. But the signals tested did not reliably predict the best provider before purchase.
Router V1 chose a different provider than the retrospective Oracle on 11 of 21 ground-truth URLs, a 52.4% regret rate. Those wrong choices represented $0.0261 in avoidable cost and 6 lost correct fields on the scored subset.
Much of the regret came from broad category rules that were right on average but wrong for individual URLs.
The decision after the benchmark was therefore:
CONTINUE_INDEX
Not BUILD_ROUTER_MVP.
The research found real economic headroom, but not a reliable enough prediction rule to justify more routing engineering yet.
The original index and the fresh holdout produced different provider stories.
On the original 35-URL index:
On the separate holdout:
This is not a contradiction. It is evidence that the best provider depends on the task sample.
That is a stronger reason to continue the Agent Utility Index than a single permanent leaderboard would be.
Direct fetch can look like the obvious low-cost architecture because there is no specialized retrieval vendor attached to every request.
But on the original provider index, direct fetch cost $0.008151 per correct field, more than twice Firecrawl's $0.003644.
On the holdout ground-truth subset, ALWAYS_DIRECT produced only 1 correct field.
The lesson is straightforward:
Low infrastructure cost does not automatically produce low task cost.
For an agent workflow, retrieval is a chain:
Page accessed → information extracted → field is correct → evidence supports it → agent can use it
A failure anywhere in that chain reduces the practical value of the original request.
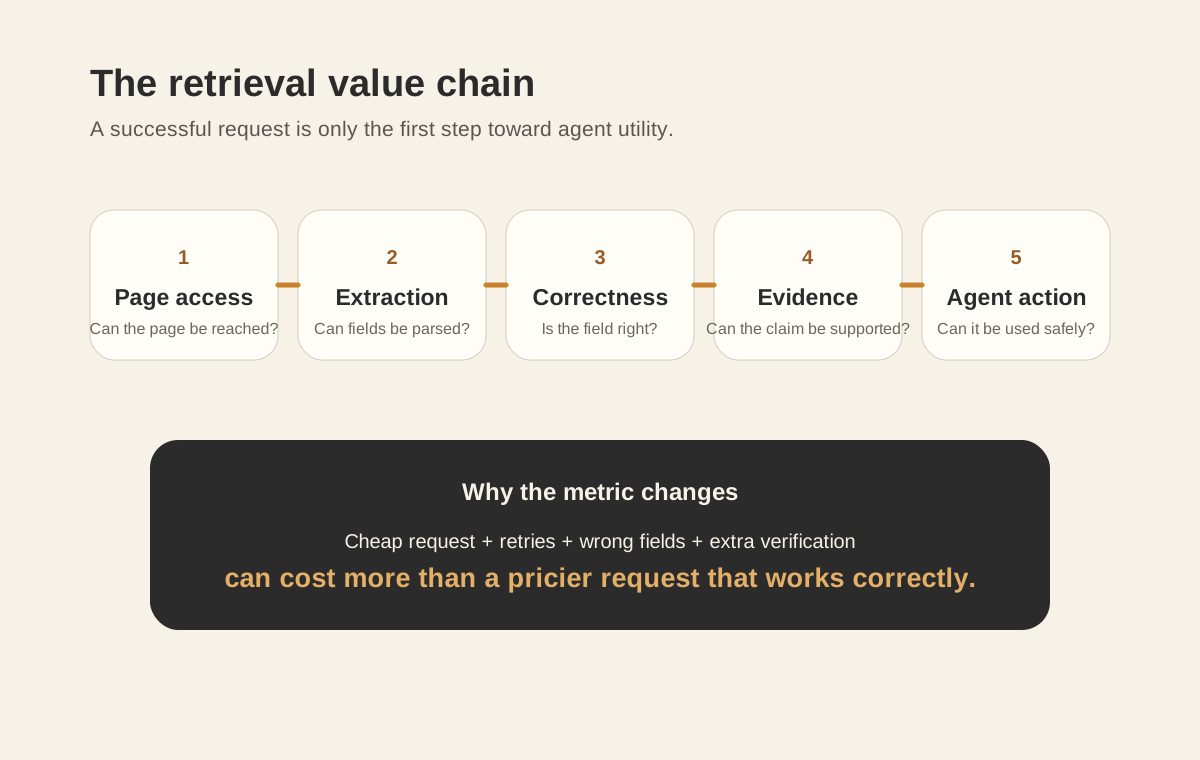
A provider can successfully retrieve a page while still returning incomplete or incorrect structured information.
One important methodological distinction is the difference between actual observed cost and reference-normalized cost.
For Bright Data, the actual 105-call run used the account's free monthly allowance, so provider cost was $0. The measured workflow still incurred evaluator cost, producing $0.059701 actual workflow cost, or $0.001047 per correct field.
For fairer cross-provider comparison, the benchmark also used a reference-normalized Bright Data request cost of $0.0015 per request, inferred from the stated free-credit value divided by the free-request allowance. This was explicitly not treated as a measured post-free Bright Data price.
Under that reference view, Bright Data's workflow cost was $0.217201, or $0.003811 per correct field.
Tavily also used a corrected reference cost assumption in the comparative index. Pricing assumptions can materially change economic rankings, so the benchmark keeps those assumptions explicit.
The fresh holdout was locked before provider calls and had zero overlap with the earlier benchmark.
The 21-URL ground-truth subset was independently fetched and hand-verified.
Two authoring errors were caught and corrected before scoring:
A separate LinkedIn URL intended for Anthropic resolved to an unrelated investment fund with the same name. The benchmark recorded the page as it actually resolved instead of rewriting the evidence after the fact.
These cases are part of the reason this project treats benchmark construction as seriously as provider scoring.
This benchmark does not establish one permanent winner.
The findings apply to the tested page sets, task definitions, benchmark environment, scoring rules, and pricing assumptions.
Important limitations include:
The Phase 4D single-pass holdout is also more fragile than the repeated-run benchmark data used elsewhere in the project.
The Agent Utility Index is not trying to answer only:
Which scraper is best?
A more useful set of questions is:
Those questions map much more closely to real agent architecture decisions.
The public-safe benchmark data is available in machine-readable formats:
The JSON summary includes both the original provider index and the routing holdout so agents and developers can inspect the dataset distinction directly.
It is most useful for AI engineers, agent builders, automation teams, and technical founders choosing infrastructure for web research, extraction, product comparison, business research, or evidence-sensitive workflows.
Firecrawl had the lowest reference-normalized cost per correct field at $0.003644. Bright Data followed at $0.003811. This ranking applies only to the original 35-URL dataset and this metric.
No. On the 21-URL ground-truth subset of the fresh holdout, ALWAYS_TAVILY produced 10 correct fields, ALWAYS_FIRECRAWL produced 5, and the retrospective Oracle produced 11. This is evidence that provider performance is sample-dependent.
No. Router V1 cost $0.01416 per correct field, compared with $0.00798 for ALWAYS_FIRECRAWL, while both produced 5 correct fields. Router V1 was 77.5% more expensive per correct field on that scored subset.
The Oracle showed real economic headroom. On the holdout it was 28% cheaper per correct field than ALWAYS_FIRECRAWL while producing more correct fields. After Bright Data was added to the original index, the updated Oracle was 37.43% cheaper than the best single provider. The opportunity exists, but the prediction rules are not reliable enough yet.
Request price does not account for failed retrievals, incorrect extractions, retries, unsupported claims, token volume, or extra verification work. Cost per correct field measures the economic cost of a usable extraction result.
No. The project produced different leaders on different samples. The benchmark is designed to measure task-specific utility, not create a permanent universal winner.
Benchmark #001 focused on web retrieval and routing economics.
Possible Benchmark #002 categories include:
The next benchmark should answer a question people are already trying to solve.
If you have a category you want tested, send it through the Work With Me page and mention Agent Utility Index Benchmark #002.
CAutomates Agent Utility Index documents practical AI-tool economics around a simple idea: useful work matters more than cheap requests.

Chrissa
Chrissa Ibiernas is a Marketing Automation, Lead Generation & AI Workflow Specialist who documents practical AI, automation, agent-readiness, and search experiments through Chrissa Automates. Contact: hello@chrissaautomates.com
Looking for creator-led content for a technology product?
See how I approach product demonstrations, tutorials, and ongoing content for AI, SaaS, automation, and technology brands.